Data table vocabulary exercise

Tables are a popular method of showing/presenting to people data/information. Like charts or graphs, tables are used to organise data, so the data is easier to understand. Although tables are not as visual as charts/graphs, they are very useful when you want to show people the actual numbers and figures. This is the reason why they are commonly used in reports.

In this online exercise, we will look at the English names of the different parts of a table (e.g. 'cell'. this is a small rectangular area where a number or information is contained). Knowing this vocabulary is important when either describing or explaining a table to people.


Exercise: The names of the parts of a business table

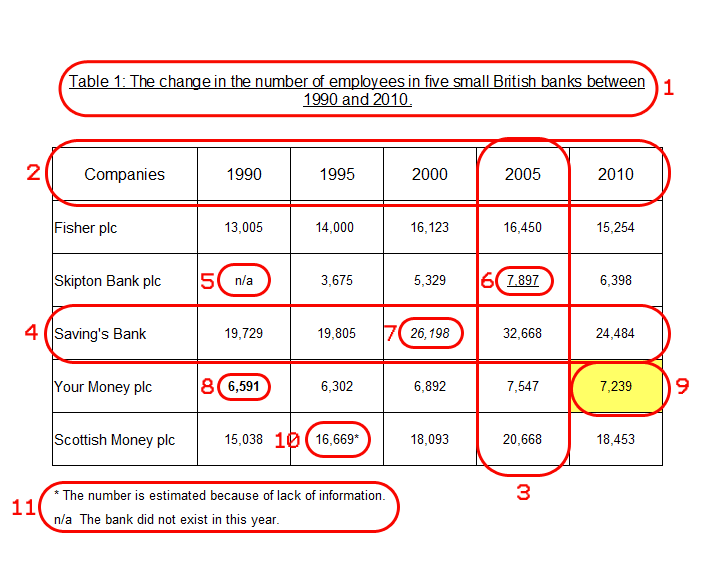
In the below table about the changes in the number of employees in British banks, you will find that the different parts are surrounded/enclosed by a red line with a number in red. These red numbers are used below the table to confirm the name of each part (e.g. 1 = title)

Focus on the names of these different parts and then do the quiz at the end to check that you both understand their meaning and remember them.

British Banks Table

  • 1 = title
  • 2 = column titles
  • 3 = column
  • 4 = row
  • 5 = not available
  • 6 = underlined
  • 7 = italics
  • 8 = bold
  • 9 = highlighted
  • 10 = asterisk
  • 11 = footnotes


Quiz: Data table vocabulary

Below is a definition/description of each of the different parts of the table which is shown above. Now fill in the blanks with the name of one of these parts which are in bold in the above list. Only use one word/phrase once and write it as it is in the list. Click on the "Check Answers" button at the bottom of the quiz to check your answers.

When the answer is correct, two icons will appear next to the question. The first is an Additional Information Icon "". Click on this for extra information on the word/phrase and for a translation. The second is a Pronunciation Icon "". Click on this to listen to the pronunciation of the word/phrase.

1. When a cell(s) contains 'n/a', it means that the data is    


Not available:
(noun) 'not available' or its abbreviation 'n/a' are commonly used in tables when you are either unable to find or use some data or information (e.g. a company didn't exist at that time or didn't have or keep records of that information). 'n/a' can also be used with the meaning of 'not applicable', which means 'not relevant'. But this is more commonly used in forms than in tables. In Spanish: "no disponible".

Close

Not available:

Close

2. When a cell(s) has a different colour to other cells, it is    


Highlighted:
(adjective) 'highlighted' is when the background of a cell(s) is in a different colour (normally a bright colour like yellow). It is used when you want people reading the table to focus on data/information that you think is important. When explaining a table to people you would say/write 'the highlighted numbers/data...' or 'the numbers/data that are highlighted...'. In Spanish: "marcado".

Close

Highlighted:

Close

3. The name of the table/chart, is the   


Title:
(noun) All charts/table should have a 'title' which explains to the people reading it what the data/information it contains is. If a document or presentation contains multiple tables or charts, it is best to start the title with chart/table and different number and a colon (e.g. Chart 2:, Table 1:). This helps people to find/locate the different charts/tables. In Spanish: "título".

Close

Title:

Close

4. The symbol '*' next to data/information in a table, is called an    


Asterisk:
(noun) The 'asterisk' or '*' is a symbol that is used with information or data in tables to advise/inform the people reading it that there is extra information about the data/information in the footnotes (the notes that are written below the table). An 'asterisk' can be used in tables either once or multiple times. In English, the 'asterisk' is always used after the data/information, e.g. '7.5*'. In Spanish: "asterisco".

<Close

Asterisk:

Close

5. When a word or number is written like this 'fish', it is in    


Italics:
(noun) 'italics' is a style of font/lettering that is used with information or data in tables to advise/inform the people reading it that the data/information is different to the other data/information. This difference can be explained in the footnotes (the notes that are written below the table) or verbally. When explaining the difference, you use 'in italics' after the number or word, e.g. 'the data in italics is estimated'. In Spanish: "cursiva".

Close

Italics:

Close

6. A vertical group of cells in a table, is called a    


Column:
(noun) A table is made up of groups/lines of cells called 'columns' (which are vertical) and 'rows' (which are horizontal). These are the two most important parts of a table. It is essential that you know these words to be able to explain tables to people, e.g. 'in the column for 1980, you will see...'. In Spanish: "columna".

Close

Column:

Close

7. Extra information about the data in a table or chart, is written in the    


Footnotes:
(noun) The 'footnotes' or 'notes' is where extra information about any data in a table or chart is placed. A 'footnote' is useful for helping people to understand a table or chart better. 'footnotes' are normally located under the table or chart. You can write one or more 'footnotes', but each must be referenced/connected to the data it refers to by symbols ('*' etc...) or by font style ( 'italics', 'bold') to avoid confusion and misunderstanding. In Spanish: "notas".

Close

Footnotes:

Close

8. When a word or number is written like this '210', it is    


Underlined:
(adjective) 'underlined' is when a word or number has a line underneath or below it, e.g. 'fish'. It is used with information or data in tables to advise/inform the people reading it that the data/information is different to the other data/information. This difference can be explained in the footnotes (the notes that are written below the table) or verbally. When explaining the difference, 'underlined' normally comes before the number or word, e.g. 'the underlined numbers are...'. In Spanish: "subrayado".

Close

Underlined:

Close

9. The words/numbers in the first/top row of a table, are called    


Column titles:
(noun) To help people understand a table better, it is normal to include a title(s) for the data/information in the first row (e.g. '1982' or 'Profit' etc...). These are called 'column titles' and they are used to help people to both understand the content of a table and when explaining/describing a table, e.g. 'if you look in the revenue column...'. Tables can also include 'row titles'. In Spanish: "títulos de las columnas".

Close

Column titles:

Close

10. When a word or number is written like this '-15.71', it is in    


Bold:
(noun) 'bold' is when the lines of a letter or number are wider/thicker than other letters or numbers, e.g. 'fish'. It is used with information or data in tables to advise/inform the people reading it that the data/information is different to the other data/information. This difference can be explained in the footnotes (the notes that are written below the table) or verbally. When explaining the difference, you use 'in bold' after the number or word, e.g. 'the data in bold is estimated'. In Spanish: "negrita".

Close

Bold:

Close

11. A horizontal group of cells in a table, is called a    


Row:
(noun) A table is made up of groups/lines of cells called 'columns' (which are vertical) and 'rows' (which are horizontal). These are the two most important parts of a table. It is essential that you know these words to be able to explain tables to people, e.g. 'in the second row, you will see...'. In Spanish: "fila".

Close

Row:

Close


Practice

Now that you understand the new vocabulary, practise it by creating your own sentences with the new words/phrases.