Exercise: Describing the type of increase and decrease in a business presentation
Read the following Annual Electricity Consumption Presenatation by the general manager of a power company. Focus on how the general manager describes the type of increases and decreases of the data/information in the chart below by using adjectives and adverbs.
Using both the context and the chart, try to guess what the meaning of the words/phrases in bold are. Then do the quiz at the end to check if you are right.
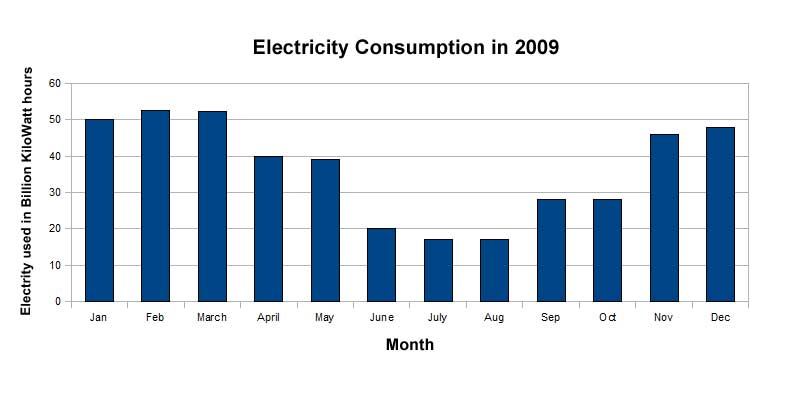
General Manager:'Now, we'll look at the electricity consumption for last year. Please look at the chart on the board. All the numbers/figures are in Billions of Kilowatt-hours(BKwH).
As you can see, in January consumption was at 50 BKwH. In February there was a steady increase of 2.5 BKwH. But in March consumption went down slightly to 52.3 BKwH. Then in April there was a sharp decline of 12.3 BKwH, due to the start of Spring. By May, there was a gradual decrease to 39 BKwH.
It was a hot June and as a consequence, there was a dramatic fall of 19 BKwH. Then July continued the downward trend and consumption dropped gradually to 17 BKwH. In August, consumption stayed the same. But then because September was unusually cold, consumption rose sharply by 11 BKwH in that month. In October there was a slight increase of 0.1 BKwH. But in November, consumption jumped dramatically to 46 BKwH. And lastly in December it increased steadily to 48 BKwH.
Does anybody have any questions?'
Quiz: Vocabulary for describing trends part 2
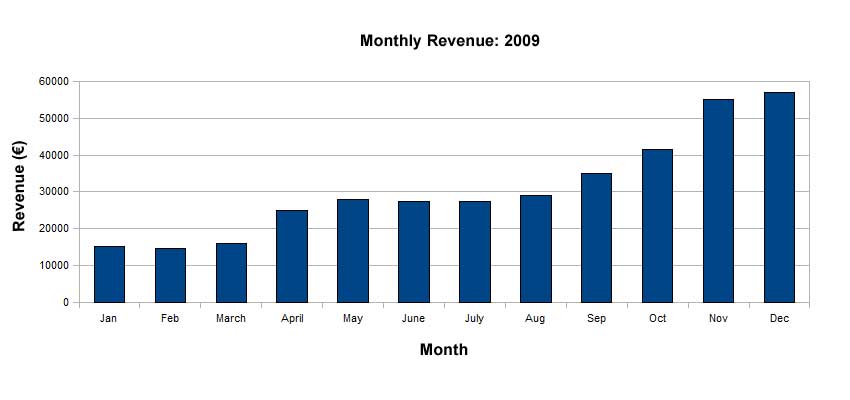
Using one of the words/phrases in bold from the above text, choose the word(s) from the question's selection box so that the sentence matches with the data in the below chart for Monthly Visitor Number to an Art Gallery. Only use one of the options in the selection box once. Click on the "Check Answers" button at the bottom of the quiz to check your answers.
When the answer is correct, two icons will appear next to the question. The first is an Additional Information Icon " ". Click on this for extra information on the word/phrase and for a translation. The second is a Pronunciation Icon "
 ". Click on this to listen to the pronunciation of the word/phrase.
Practice
Now that you understand the use of adjectives and adverbs to describe levels of increase and decrease, you can draw your own line chart to show the differences between slight, gradual, steady, sharp and dramatic.
Follow us on  or on Twitter