How to write business reports exercise

Business reports are one of the most important things that you'll ever have to write at work. Unlike other things you will write at work, you can be sure that what you write in them will not only be read by senior management, but will be used to make important decisions in the company or organisation.

If you have never written a business report before, it is difficult to know what you have to do. Although you can read web pages or books on how to write the perfect business report, until you actually have to use a business report yourself to help you make decisions, you won't know what you have to include (and not include) and how you should present and structure it.

To help you do this, I have created the below exercise (an example with a quiz) on writing business reports. Instead of telling you what you should do to write a good business report, you will learn yourself what makes one.

When you do this exercise, put yourself in the position of a manager who has asked one of their staff to write a report for them. And they have produced the below report for you.

When reading the report, ask yourself:

  • Is it clear what the report is about?
  • Do you trust what they have written?
  • Does it contain all the appropriate information you need to make the right decisions?
  • Is it presented and organised/structured in a way that makes it easy to understand and read?

The purpose of this exercise is for you to learn what type of things you have to include (and not include) in a report and how to structure one. Although you can use the example below to learn words and phrases that you can use in your own reports, don't focus on this when reading the example. I have created another online exercise for 'learning the vocbulary to use in business reports' for this.

Once you have done the below exercise (and learnt what makes a good report), I would recommend that you then focus on learning vocabulary to use in them.


Example & Exercise: The report

Imagine that you are the manager of a customer services department in a small bank. A recent customer survey has shown that a lot of customers are not happy with the service provided by the help desk which takes customer calls. You have asked one of your staff to review the performance of the help desk and make recommendations on how it can be improved.

Below is the report that they have created:

Report on the customer help desk's inbound customer call performance

Introduction

The following report evaluates the current performance level of our customer help desk based in Pudsey, Leeds. It focuses on its performance when dealing with inbound/incoming customer enquiries made by phone.

This report was produced in response to the results of a recent customer survey. This survey identified a high level of customer dissatisfaction with our company's help desk. Of the 1506 customers who left a rating for the help desk in the survey, 1254 of those rated the service as bad or terrible. Of this 1254, 67% gave the reason for their dissatisfaction as 'call waiting time', while 25% said that the 'service is unhelpful'.

The purpose of this report is to identify failings with the current set up of the help desk which could account for this low customer rating. And to recommend changes to the help desk to improve the service provided to customers.


Procedure

The findings which are contained in this report are predominantly based on a combination of statistics from the help desk's call management system (CallCom) and random monitoring of calls (100 in total) between customers and help desk analysts. Both the statistics and the call monitoring stem from the same 7 day period (4 May to the 11 May 2015).

In order to ensure the integrity of the results, during the period of evaluation, nobody in the help desk section was aware that an evaluation was being conducted.

After this 7 day period, a number of interviews with staff at the help desk (the manager of the section, a team leader and 6 help desk analysts) were then conducted to hear their views and opinions.

In addition to the above, I also reviewed the processes and procedures in place at the help desk for dealing with inbound/incoming call customer enquiries.


Findings

Customer waiting time

From reviewing the statistics from CallCom, one thing did stand out, the customer waiting time (before a call is answered by an help desk analyst). The length of customer waiting time varied throughout the day. During most of the day, the average waiting time for customers was around 25 seconds, but during 5pm to 9pm (except on weekends), this rose to an average of 3 minutes and 44 seconds.

These 4 hours of the day, coincide with the highest call volume of the day for the help desk. On average, 41% of all calls each day were received during these 4 hours.
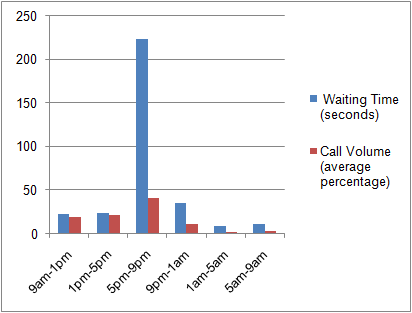
Chart showing the average customer weekday waiting time and the average percentage of calls received during the period of the study.

During these peak hours of call volume, the help desk does have more analysts answering customer calls. On average 10 extra staff (mainly part-time) are answering customer calls during these peak hours.

Length of call

Not only did customer waiting time increase during these peak hours, but there was also an increase in how long staff were actually speaking with customers during these hours as well. During 5pm to 9pm (except on weekends), the average time that analysts spoke to customers increased from 4 minutes 23 seconds to 7 minutes and 59 seconds.
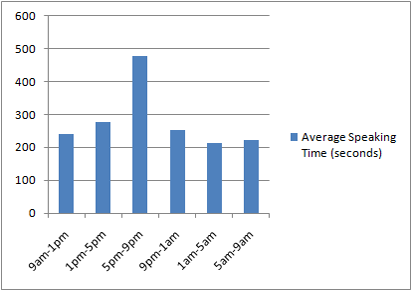
Chart showing the average length of help desk analyst speaking time with customers during the period of the study.

During these peak hours of call volume, the nature of the calls did not differ significantly from those received during the rest of the day. But what did stand out was a difference between the length of time that full-time analysts spoke to customers during these peaks hours (on average 6 minutes and 56 seconds) and part-time analysts (on average 9 minutes and 28 seconds).

The statistics from ComCall indicated that although part-time analysts performed only slightly slower than their full-time counterparts on simple enquiries (e.g. confirming account and balance information), they performed significantly slower on more complex enquiries (e.g. freezing and resetting accounts).

Monitoring of customers calls supports this. On more complex enquiries, part-time staff put their customers on hold more often and for longer while they consulted with other staff to find out what they had to do.

Call procedures and processes

The procedures and processes that are in place in the help desk for dealing with customer enquiries meet the industry's highest standards (the standards set down in the Financial Services Association's customer service best practices).

Through monitoring calls between customers and help desk analysts, I can confirm that the vast majority of analysts always followed set procedures when dealing with customer enquiries. Furthermore, except for one or two occasions, they dealt with customers in a professional manner (even when customers were aggressive).

The help desk's customer application system

From conducting interviews with help desk analysts, one of the things they stated was an issue was the slowness of the help desk's customer application system. In particular, they stated that the system had a tendency to run slow at peak hours (between 5pm to 9pm on weekdays). Resulting in them taking longer to deal with customer enquiries.

The monitoring of customer calls seems to confirm this. Analysts performed tasks using the system a lot slower when there were more staff taking calls (during peak call volume hours) than when there were less staff taking calls during the rest of the day.


Conclusion

The findings of this report on the help desk's performance would strongly seem to indicate that there is a problem with dealing with customer calls only during the hours of peak call volume (between 5pm to 9pm on weekdays). During these peak hours, the average waiting time for customers was nearly 10 times higher than during other times of the day (from an average of 25 seconds to an average of 3 minutes and 44 seconds).

Although it would appear that simply increasing the number of help desk staff taking calls would resolve this issue, the rise in the average time that analysts spoke to customers when dealing with enquiries (an average of 7 minutes and 59 seconds at peak call volumes in comparison with an average 4 minutes 23 seconds outside of these hours) would indicate that it is not only a problem of not having enough staff on at these times.

Although having more staff taking customer calls at these times should reduce the average customer waiting time, it would not address the issue of customer enquiries taking longer to resolve at these times. It would appear that this is the main factor causing the longer waiting times that customers are experiencing.

The findings would appear to demonstrate that this issue is caused by two main reasons:

  • The help desk's customer application system
  • The underperformance of part-time staff

The first (and most important) reason is that there appears to be a problem with the help desk's customer application system. It appears to run a lot slower during periods of peak call volume when more analysts are logged on and using it.

The second reason is that part-time staff complete tasks slower on average than their full-time colleagues. This would appear to not stem from a lack of willingness on their part to answer calls quickly, but that they have less experience on resolving more complex customer enquiries.


Recommendations

On the basis of the above findings, I make the following recommendations:

1. Request the I.T. department to perform an investigation into the problems experienced with the help desk customer application system as soon as possible.

2. Undertake a training programme for part-time help desk staff to improve their knowledge and speed in dealing with customer enquiries (especially more complex enquiries).


Contact

If you require any clarification or further information on the report, please do not hesitate to contact myself (James Smith) by email (jsmith@suttonbank.com) or by phone (01535 666541).


Click to see more email/letter exercises & examples


Quiz:

Below are 8 questions about the above business report. Choose the correct answer from each question's selection box. Click on the "Check answers" button at the bottom of the quiz to check your answers.

When the answer is correct, this icon will appear next to the answer. Click on it to find extra information about the answer (e.g. why it is correct).


1.

What things should you write about in the introduction of the report?


What the report looks at, why you are writing it and the purpose:
In the introduction of any report you need to write about three things:

  • What the report looks at (what exactly it concerns)
  • Why you are writing it (the reason(s) behind the report being written)
  • The purpose (What exactly the report wants to achieve, e.g. solve a problem)
In addition, you need to talk about them in the introduction in a specific order (the order you see above).

You need to include these three things not only because people expect to find them in the introduction, but also because they make sure that people understand everything else they are going to read in the rest of the report. If you miss any of these parts, you are increasing the probability that they'll misunderstand, be confused or not be convinced by what is contained in the rest of the report.

Close

2.

What is the reason why the different sections on the report are in the order they are?


Each section naturally flows to the next section:
Although you will find that the majority of reports contain the same type of sections (e.g. introduction, procedure, findings etc...), their names and the order in which these are arranged may differ. In some reports (especially long ones), you may find the conclusion and the recommendations come straight after the introduction.

For me personally, I believe that the best order to use is the one which you see in the example in this exercise. With this order, the information contained in each section helps the reader understand the information contained in the next section and legitimizes it. For example:

The introduction section tells the reader(s) what the report's about, why you are doing it and its purpose. The procedure section then explains what you did in the study. The findings section then shows what you found. And so on and so on.

Close

3.

Why are certain words in the report in a larger font than others?


To help people to both quickly know what they are looking at and find information:
Creating a good report is not only about how well written it is and how appropriate the information contained in it is, but also how easily this information can be found. You need to make sure that there are clear divisions between the different sections in it. If you don't, people reading it may have problems knowing where one section stops and another starts.

In addition, you also need to help people to find sections (and specific information) quicker in the report when they are rereading it.

For me, the best way to do this is to make clear separations between the sections. The easiest way to do this is to use titles for each section and make these titles look more important than the rest of the text, To do this, you should use a bigger lettering/font size for section titles than for the rest of the text. You can also use a different colour or font to further show that these titles are different and more than important than the rest of the text.

In addition to this, make sure there is a clear separation between the different sections. Leave a large amount of white space between where one section finishes and another begins. You can also separate each of the sections with a line, like I have done in the report example in this exercise.

You may also want to make subsections within sections (especially in the findings section). If you do this, I would recommend that you again use titles for each subsection. But if you do, use a lettering/font size for these titles which is bigger than the rest of the text (so they stand out), but not as big as that used for the section titles.

Close

4.

What style of vocabulary should you use on a report?


Formal:
Because most reports will be read by senior management, the choice of vocabulary you use in your report is important. Use formal verbs and words to make the report sound more professional. For example, instead of using 'can', use 'be able to', or 'conducted' instead of 'did'.

In addition, don't use contractions in your writing (e.g. "I'd", "They've" etc...). Instead, use the full form instead (e.g. "I would", "They have" etc...).

The exception to this rule is with possessives (e.g. Simon's car etc...). These are perfectly fine to use in reports.

Close

5.

Why in the findings of the report does the author write about 'call procedures and processes', when they aren't causing any problems to performance?


The people reading the report will have considered them to have been a likely cause:
In your findings, you don't only write about issues that you identified, but also about things where there are no issues. The problem about doing this is if you write about everything where you didn't find any issues, your report could end up being very long. And any piece of writing which is excessively long is not good. So, you need to be selective in what your include and don't include.

The art of good report writing is predicting what things the audience you are writing it for will want to know about. If the report's purpose is to identify problems, the people who will be reading it will already have some preconceived ideas before they read it what these problems could be caused by. So think about what these are and if your analysis or investigations confirms that they are not the cause, make sure that you explain that they are not in your findings.

If you don't include these (and trust me about this), people will question the validity of your report.

Close

6.

What is the main reason for including a section called 'procedure' in a report that you write?


To justify your findings and recommendations:
If you want people to trust what you've written and perform your recommendations, you must explain to them how you came up with your findings. You need to explain to them exactly what you are basing your findings on (e.g. what sources you used, where you got your data from etc...) and the scope of your study (e.g. the date(s) the study was conducted, how many people and who was involved etc...). If you don't, the people reading it will question if the things you write about in your findings and conclusion are opinions rather than facts.

I would recommend that you always place this section just before you present your findings in the report.

Close

7.

Why are two charts included in the report?


To make data more understandable:
Although including graphics and charts in a report does make it look nicer, it's not the main reason why they should be included. They are used to make data more understandable to the people reading it. And making your report easier to understand should be one of your main goals when writing it.

I would recommend that you don't use too many charts in reports that you write. If you do, the graphics and charts can lose their significance. Only use charts to present data which you think is important and you want the people reading it to focus on.

Close

8.

What is the main reason why you would include a contact section at the end of the report?


To keep the report short:
There are three main reasons why I would include a contact section in any report you write. The first is to tell the people reading it who wrote it (although you can also do this by writing your name under the title of the report at the beginning as well). The second, is to provide them with a way to contact you if they have any questions about the report (so, include your email address and a phone number). And the third (and most important) is to help you to keep the report short.

Most studies which lead to a report will produce a large volume of information which can be used. The art of good report writing is to know what to include in the findings of your report and what not to.

Even the best writers of reports will be unable to predict everything people will want to read about in the reports they write. So unless you write about everything you evaluated in your study (which is a terrible thing to do), you need to offer the people reading the report the opportunity to contact you if they want to know about something you didn't include or cover in depth in it. And this is the main reason why I would recommend that you include a contact section in your reports.

You'll find that many reports you'll read don't include a contact section. But because of the reasons I have stated above, I would recommend that you do.

Close


Practice

Now that you understand what makes a good report, now learn the words and phrases you should use in the exercise on the 'vocabulary to use when writing business reports in English'.